Analysis Templates
Analysis Reports are the most commonly used reports in WebSpy Vantage. Each node in an Analysis report defines a Table and a Chart.
You can arrange nodes as siblings at the same level, or underneath a parent node to create drilldowns.
For example, you can create a node to show the Top 10 Users, and the Top 10 Sites overall, or drag the Top 10 Sites node underneath the Users node to show the Top 10 Sites for each of the Top 10 Users.
Once defined, an Analysis Template can be used to generate a Template Analysis on the Summaries screen, or to generate a Report document (PDF, Web document or Microsoft ® Word, CSV or Text), or publish a report to the Web Module.
Creating an Analysis Report Template
To create an Analysis Report Template:
- Click the Reports tab at the top of the screen.
- Click the Analysis Reports tab at the top of the Reports tab to view all existing Analysis Reports.
- Click the New Template button in the left Navigation bar. This launches the Add Template dialog.
- Give your template a name such as 'Web usage report' in the Name edit box
- Select the Schema that you want to report on from the Schema dropdown list. Only Schemas available in your open Storages are shown here.
- Ensure the 'Analysis' radio button is selected and click OK.
Adding Content to Analysis Report Templates
You can now build the content you want to see in the report by adding Nodes. Each node defines a table and a chart using the Summaries in your data as Key columns, and custom Aggregate columns (anything in your schema that can be summed, such as size, browsing time, number of x etc.)
As an example, let's add two nodes to display the top sites visited for each of your top users. This of course assumes you are reporting on a Schema that contains users and URLs.
First, add a node that shows your Users:
- Make sure you are editing your Report Template and click New Node. This launches the Template Node dialog.
- Enter 'User' in the Name edit box and select 'User' from the Summary drop down list.
- Select 'Usernames' from the Alias drop down list and select 'Hits' in the Sort by drop down list.
- Click OK to add the Node (note there is also an option to click Advanced to Customize the columns, charts, filters and more for this node.)
Now let's add a node that drills down into each of the returned users, and extracts the sites visited for each one:
- Ensure the User node is selected and click the New Node button to launch the Template Node dialog again.
- Enter Sites in the Name edit box and select 'Origin Domain' from the Summary dropdown list. Leave the Aliases dropdown set to 'none'.
- Select 'Hits' in the Sort by drop down list.
- Click OK .
You now have an Analysis Template that will drilldown into each User and display the Web Sites visited by each one.
You can now generate the report as a document, publish the report to the Web Module, or select the template for a Template Analysis on the Analysis tab to see the results.
Analysis Report Template Nodes
The example above creates two nodes in the report with basic settings. When you edit an existing node, or click the Advanced button when creating a new node, you are presented with a more advanced editor that gives you full control over the table columns, sorting, charts, filtering and number of rows limit (e.g. top 20).
Double-click a node to edit it and launch the Advanced editor. The Advance template node editor has the following pages:
General
The General page enables you to Name the node, provide description and define the columns in the table.
There are two types of columns:
- Key Columns
A Key column consists of one of your Summaries, along with an optional Alias applied to it. The resulting table will contain a new row for each value in your Key column. You can also add more than one Key column to a template node. The resulting table will contain a new row for each unique combination of the two key columns.
For example, if you want to see a list of websites, add a key column using the Origin Domain Summary. If you want to see whether each website is productive or unproductive, add another Key column selecting Category as the Summary, and Productivity as the Alias. Use the Up/Down arrows to put the two key columns in the desired location in the final table.
You can also create your own Key columns that are not defined in your Schema using the Custom Expression option. Select a Summary and optional Alias, then click the Custom Expression option to see its underlying field expression. You can then the WebSpy Vantage Filter Expression Language to create apply functions and operators to these expressions.
For example, you can concatenate two fields together such as Site URLs and Site Queries to rebuild full URLs with
[Site.GetBaseUri] + [Site.Query]. Or display a comma separated list of Categories withCombineArray([Category]).
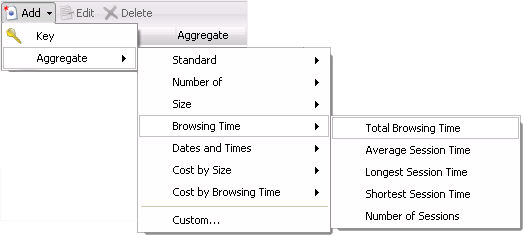
- Aggregate Columns
Aggregate columns consist of any field in your log file that can be aggregated (summed, averaged, min/max etc). Vantage comes with a number of functions to aggregate your fields and summaries, such as Browsing Time (Total Browsing Time, Session Time, Average Session Time etc - see Sessions and Browsing Time), Number of (Count of users, Origin Domains etc), and Size (Total, Average, Max Bytes etc). The Aggregate Columns you add here can then be used for Sorting and Charts.
Once added, you can edit the Aggregate column to change its name, the function being used (min, max, average etc), or the field it is using.
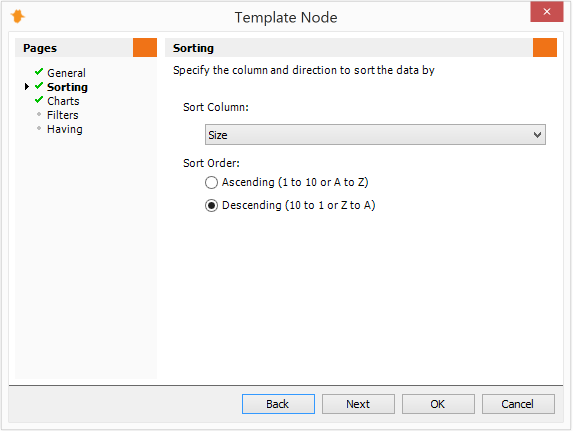
Sorting
The Sorting page configures how the table is sorted, using one of the Aggregate columns defined on the General tab.
Simply select which aggregate column you want to use in the Sort Column drop down list, and whether the sort should be Ascending (1 to 10 or A to Z), or Descending (10 to 1 or Z to A).
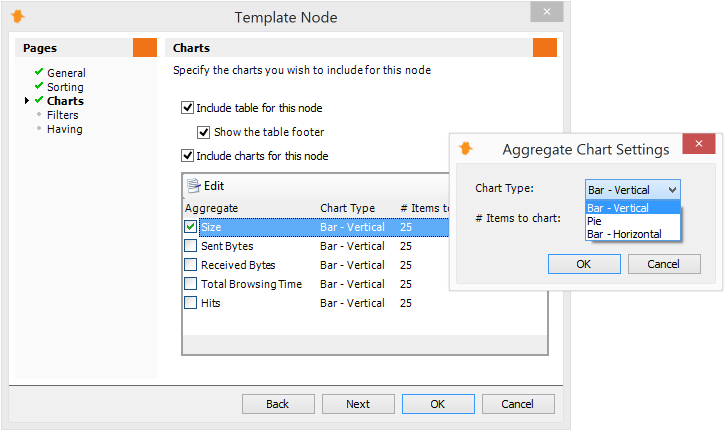
Charts
The Chart page configures the visibility and type the chart(s) that should be displayed, as well as the visibility of the table and/or the table's footer that shows totals.
Any aggregate columns defined on the General tab can be selected on the Charts page. Check the checkbox next to each Aggregate that you would like to display chart for. Usually, you would select the same column as the one you selected as the sort order of the node.
The type of chart can be a Vertical or Horizontal Bar Chart or a Pie Chart. This is changed, by selecting the Aggregate column and clicking Edit.
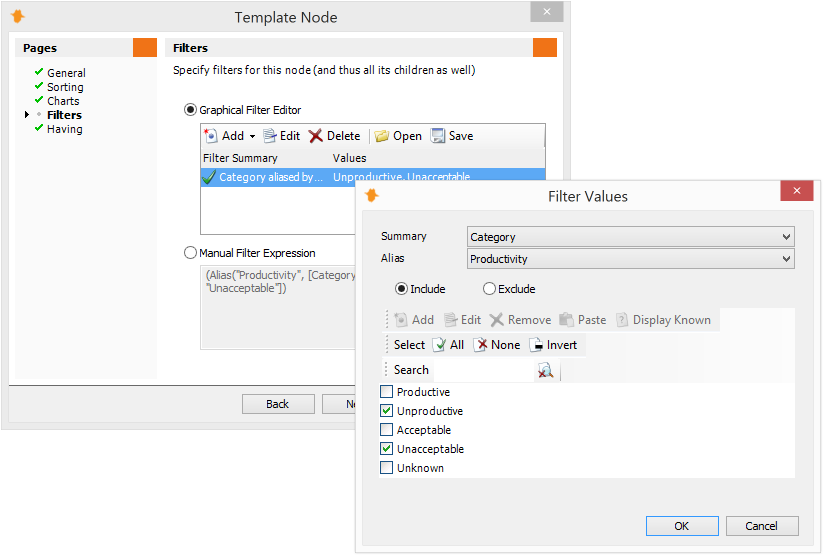
Filters
Each Node in a report can be filtered to include or exclude any log data. For example, you may want a node to only show 'Unproductive' web traffic, or perhaps data from a specific site such as youtube.com.
The Filters page enables you to define these filters. Click the Add button on the tool bar to add a filter. You will usually want to use the Field Value Filter options to include or exclude log data.
Be cautious of adding Date filters to a Node, as these filters will be 'baked in' to the report and when you run the report on different dates in the future, the node will not return any data.
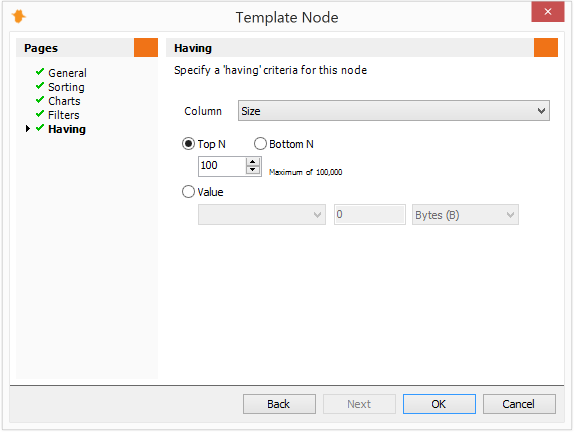
Having
The Having page configures a limit for the node's table, such as the Top 100 by Browsing Time, Top 20 by Size, or values greater than 100 MB.
You can select both Key and Aggregate columns as the limit. Be aware that if you select a Key column, the limit will be applied alpha numerically. For example, if you select Users as the Column, and Top 20 as the limit, the result will be the Top 20 users sorted alphabetically. It usually makes the most sense to choose the same column as the one defined for the sort order on the Sorting page.
Ordering and Structuring Analysis Template Nodes
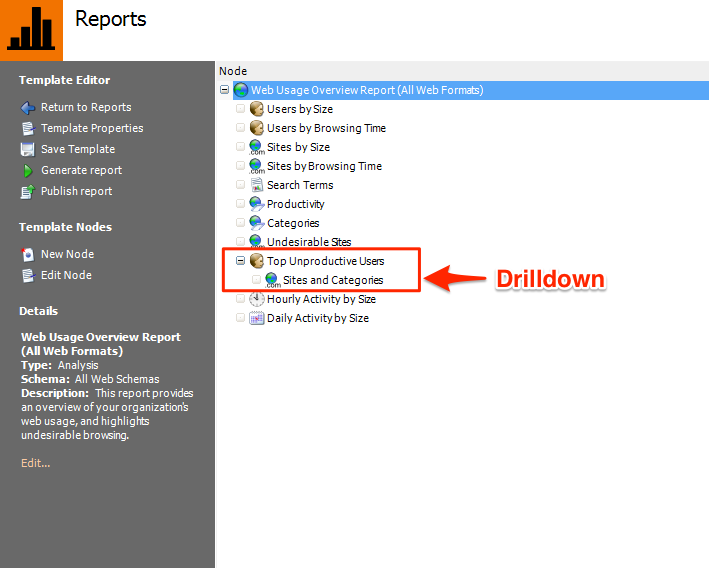
You can drag and drop Template Nodes to reorder them. If you drag/drop a node underneath another node, this creates a Drilldown. This means that for each result of the top node, a new 'sub-report' is created.
For example, you can create a node that shows your Top Unproductive Users, and add a node underneath it to drilldown into each user and show more information such as the Sites or Categories accessed by each of those users.
Once you have built the analysis template by adding Nodes and ordering/structuring them as desired, you can Generate the report as a document, publish the report to the Web Module, or select the template for a Template Analysis on the Analysis tab to see the results.