Reports
WebSpy Vantage can send Reports to other members of your organization as a document (PDF, Word, HTML, Text or CSV), or publish reports to the Web Module for secure access.
The Reports tab enables you to define the content of your reports using Report Templates, and then generate report documents, or publish reports to the Web Module using these templates and the data in your storages.
You can either create a custom report for your log format's Schema by clicking the New Template link in the Templates task pad, or generate one of the many sample reports.
Simply click the Generate button
 on the selected template to create a report document (PDF, Word, HTML, CSV or Text), (see
Generating Reports). Alternatively, click the Publish Report link to publish the report to the Web Module.
on the selected template to create a report document (PDF, Word, HTML, CSV or Text), (see
Generating Reports). Alternatively, click the Publish Report link to publish the report to the Web Module.
Types of Report Templates
You can create three types of reports:
-
Analysis Reports
Analysis Reports are the most commonly used reports in WebSpy Vantage. Each node in an Analysis report defines a Table and a Chart. You can arrange nodes as siblings at the same level, or underneath a parent node to create drilldowns. For example, you can create a node to show the Top 10 Users, and the Top 10 Sites overall, or drag the Top 10 Sites node underneath the Users node to show the Top 10 Sites for each of the Top 10 Users. For more information, see Creating an Analysis Template). -
Trend Reports
Like Analysis Reports, each Node in a Trend Report defines a table and chart, only Trend Reports utilize statistical functions to calculate trends over time and predict values in the future. For example, instead of a chart and table showing the top 10 users by size, Trend Reports enable you to define a time series chart showing the size of the Top 10 users over time. For more information see Creating Trend Reports). -
Comparison Reports
Comparison Reports provide a simple user interface to define a template with up to four drilldowns. For example, For the top 10 users, show the top 10 categories, and for each of the top 10 categories, show the top 50 Origin Domains. You can also do this using Analysis Templates, but the Comparison Reports offer a simpler interface.
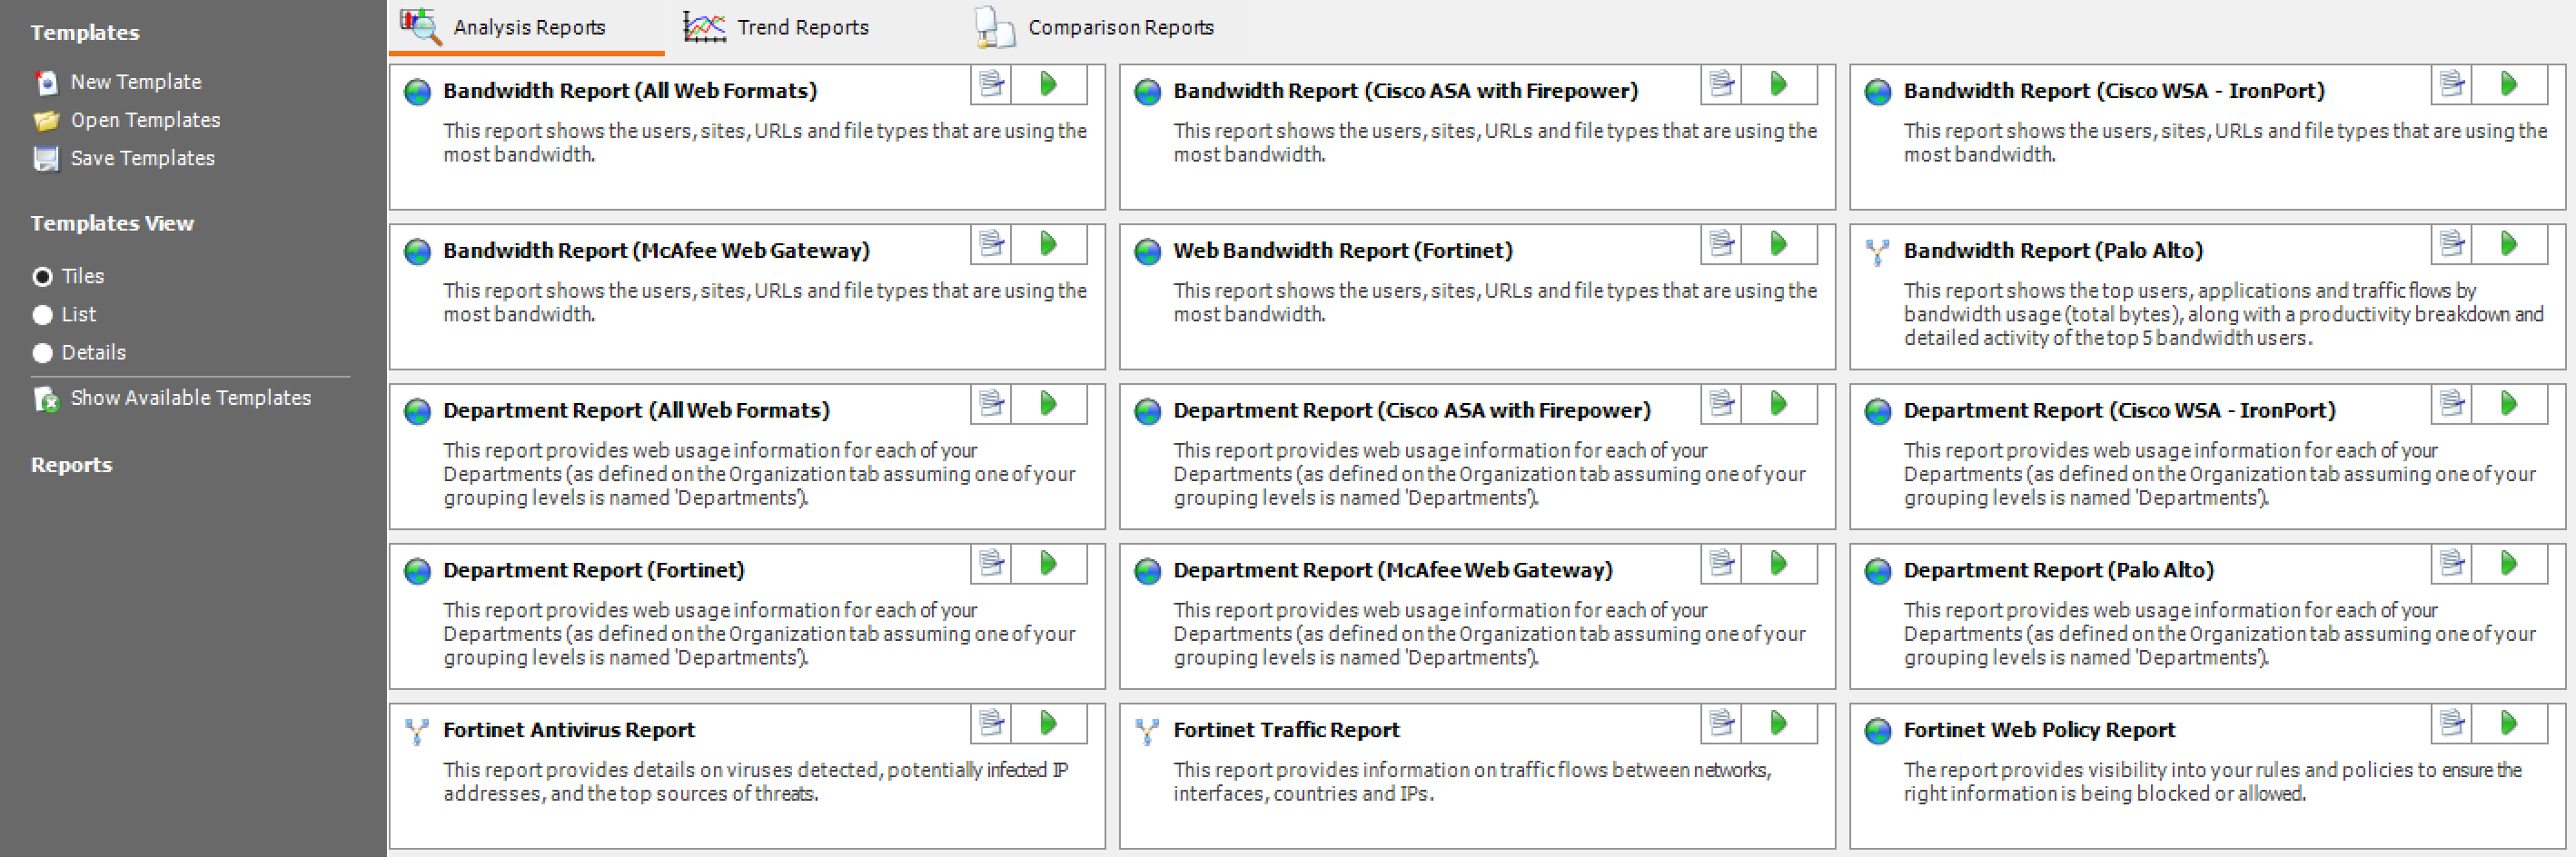
To access each type of report, simply click the corresponding tab at the top of the Reports dock.
Changing Views on the Reports tab
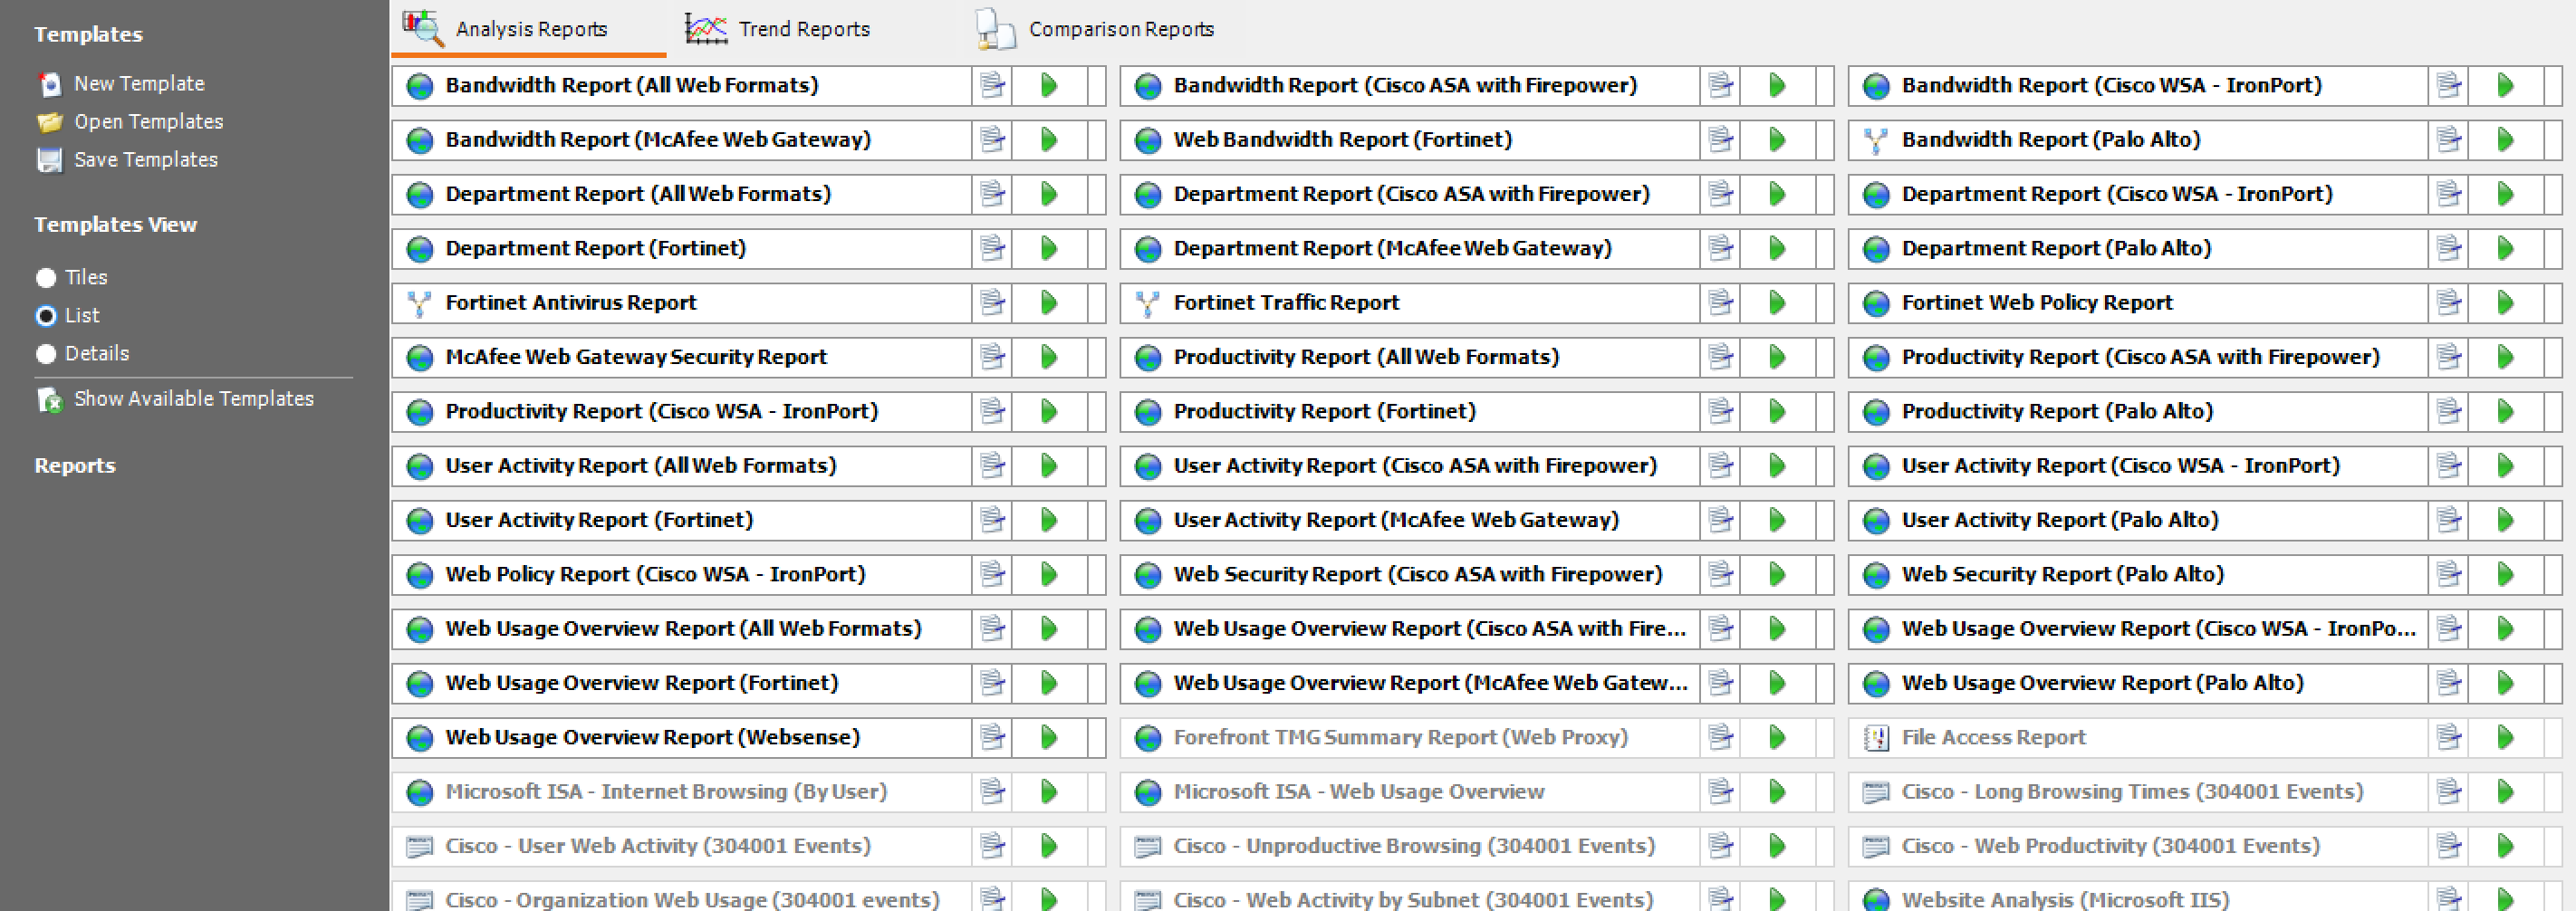
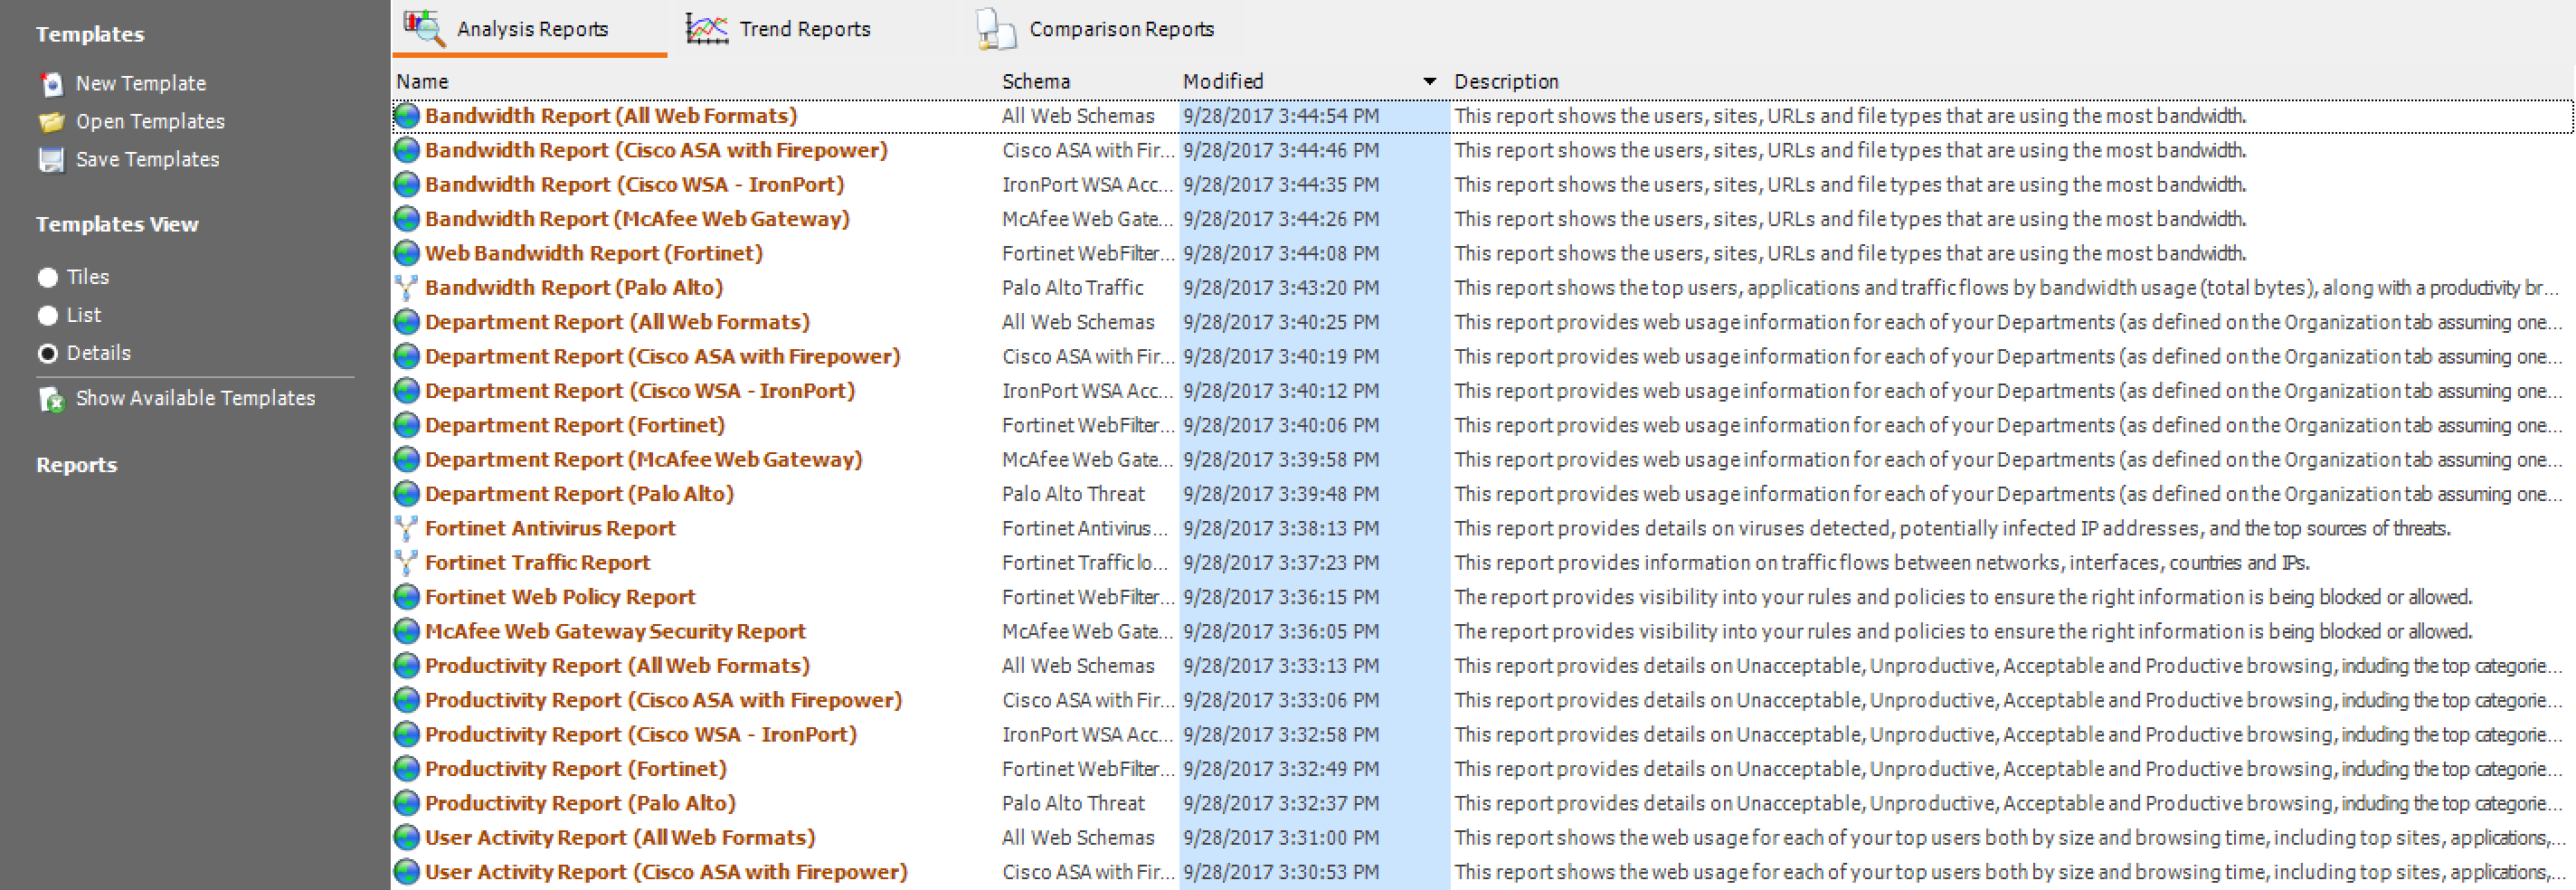
To change the view of templates simply click on either Tiles , List or Details under the Templates view task pad.
Tiles view
List view
Details view
Note: Some of the sample reports may not be available to generate depending on the schema you are analyzing. You can toggle the visibility of these reports using the Show Available Templates link.
Template Properties
Each Report Template has a Name, Description, Schema and optional Filters. All of these, with the exception of Schema can be changed using the Report's Template Properties dialog.
To access the Template Properties dialog, click the Template Properties link when editing or selecting the template on the Reports tab.
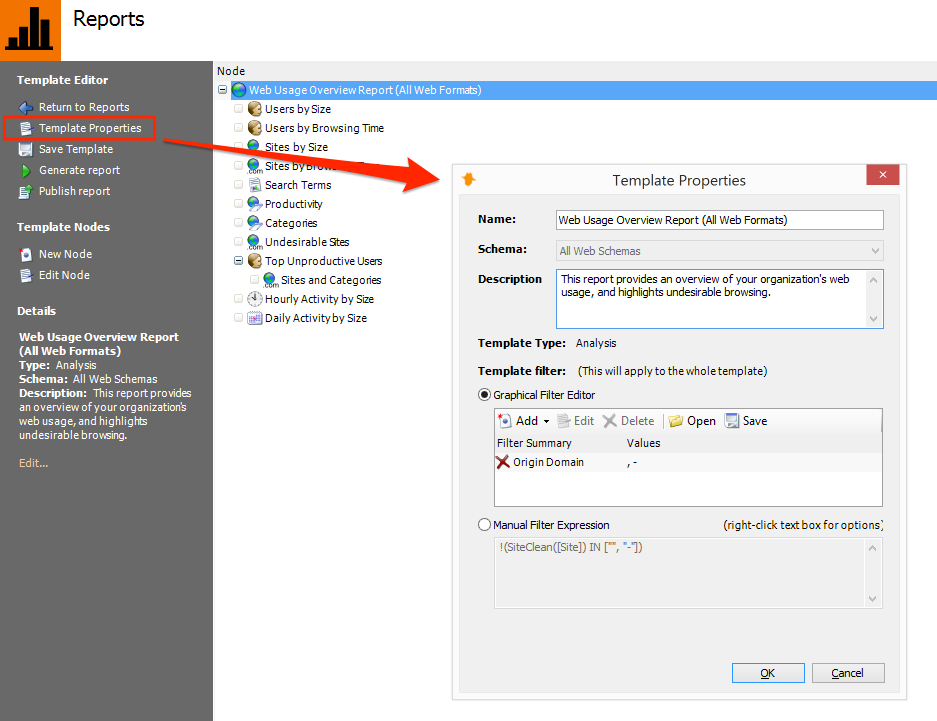
Any Filters defined in the Template's Properties will apply to all nodes in the report.